Summary
The reduction in charge up time for my Kalkhoff 18Ah battery (~26V), which has occurred during the 23 charge ups in its first 11 months from new, suggests a reduction in capacity of 6% per year. If degradation continues at that rate I will have still have 12Ah capacity after 5 years.
Record of charge ups
In June 2011 when my Agattu was just 2 months old, I posted a plots of my first 9 charge up times,
(see: http://www.pedelecs.co.uk/forum/electric-bicycles/8976-kalkhoff-agattu-range-9-charges-18ah-battery.html#post109828)
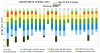
The 18Ah battery is now nearly 11 months old and I have done 23 charge ups shown in the following plot:

The charger provided by Kalkhoff regulates the charging current to a constant 1.8 Amps until the voltage reaches about 29.35 Volts then it maintains a constant voltage with the current gradually dropping. The charger switches off when the charging current has been reduced from 1.8A down to about 0.8A. This is what I have called the ramp down, shown by the the light green bar at the fully charged end of each plot.
One can calculate the total Ah absorbed in each charge by multiplying the duration of each charge (in hours) by 1.8A, and making a small correction for the reduced current during the ramp down.
For charges numbers 9, 10, 14, 15, 16, 19 charging was terminated immediately LED 5 stopped flashing and became steady. The grey area on those bars is an estimate of the additional time the charging would have lasted had it been continued to the fully charged state.
On receipt of the new battery charge number 1 took place from the sleep state which judging from the charge duration must have been in a deeply discharged condition. The longer time for each stage of charge 1 could be due partly to additional current being taken to balance the cells. There is an animation showing cell balancing in the link I posted here.
Variation of charge up capacity

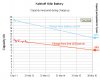
Charges numbers 3, 5, 13 and 21 were from the low voltage cutoff point, so on these charging cycles the battery had been completely discharged before charging commenced. I noted that the time taken to do these complete charges had fallen very slightly over the last 11 months. Fitting a straight line to these 4 points and extrapolating this rate of fall to 5 years leads to the prediction that the charge up capacity of the battery will then be reduced by one third to 12.6Ah. A linear extrapolation may not be correct, perhaps the rate of decline will change. I will know more at the end of the second year. The battery warranty is due to expire after 2 years. At the moment it looks as if the battery will easily outl;ife its warranty period.
Using just 4 data points to derive the rate of decline could be rather limited in accuracy, so I have plotted a second set of points, in red, for 13 charges from the moment when the 2nd LED becomes illuminated steadily up to fully charged. This is nominally 40% charged up to fully charged.
Extending both these lines to 5 years suggests a 29% reduction over 5 years red points with the blue points figure of 33%,which is a very reasonable agreement.
Coulombic or Faraday Effciency (see Faraday efficiency - Wikipedia, the free encyclopedia)
The Coulombic efficiency can be defined as Ah during discharge divided by Ah during charge. For Li-ion batteries it seems to be 99% or higher. Some authors quote lower values but invariably it seems that they are quoting energy efficiency which is indeed somewhat less because of the small voltage drops during charge and discharge.
It is of course discharge capacity that is important, but until I can make some direct measurement of the discharge capacity for comparison with the charge capacity, I will assume >99% Coulombic efficiency and so claim my measurements show that my Kalkhoff 18Ah battery may drop to 12Ah capacity after 5 years. This is a very much longer life than I had anticipated before purchase after reading many warnings to budget for a replacement in one to two years, even with low usage such as mine of 2 cycles per month.
The reduction in charge up time for my Kalkhoff 18Ah battery (~26V), which has occurred during the 23 charge ups in its first 11 months from new, suggests a reduction in capacity of 6% per year. If degradation continues at that rate I will have still have 12Ah capacity after 5 years.
Record of charge ups
In June 2011 when my Agattu was just 2 months old, I posted a plots of my first 9 charge up times,
(see: http://www.pedelecs.co.uk/forum/electric-bicycles/8976-kalkhoff-agattu-range-9-charges-18ah-battery.html#post109828)
The 18Ah battery is now nearly 11 months old and I have done 23 charge ups shown in the following plot:
The charger provided by Kalkhoff regulates the charging current to a constant 1.8 Amps until the voltage reaches about 29.35 Volts then it maintains a constant voltage with the current gradually dropping. The charger switches off when the charging current has been reduced from 1.8A down to about 0.8A. This is what I have called the ramp down, shown by the the light green bar at the fully charged end of each plot.
One can calculate the total Ah absorbed in each charge by multiplying the duration of each charge (in hours) by 1.8A, and making a small correction for the reduced current during the ramp down.
For charges numbers 9, 10, 14, 15, 16, 19 charging was terminated immediately LED 5 stopped flashing and became steady. The grey area on those bars is an estimate of the additional time the charging would have lasted had it been continued to the fully charged state.
On receipt of the new battery charge number 1 took place from the sleep state which judging from the charge duration must have been in a deeply discharged condition. The longer time for each stage of charge 1 could be due partly to additional current being taken to balance the cells. There is an animation showing cell balancing in the link I posted here.
Variation of charge up capacity
Charges numbers 3, 5, 13 and 21 were from the low voltage cutoff point, so on these charging cycles the battery had been completely discharged before charging commenced. I noted that the time taken to do these complete charges had fallen very slightly over the last 11 months. Fitting a straight line to these 4 points and extrapolating this rate of fall to 5 years leads to the prediction that the charge up capacity of the battery will then be reduced by one third to 12.6Ah. A linear extrapolation may not be correct, perhaps the rate of decline will change. I will know more at the end of the second year. The battery warranty is due to expire after 2 years. At the moment it looks as if the battery will easily outl;ife its warranty period.
Using just 4 data points to derive the rate of decline could be rather limited in accuracy, so I have plotted a second set of points, in red, for 13 charges from the moment when the 2nd LED becomes illuminated steadily up to fully charged. This is nominally 40% charged up to fully charged.
Extending both these lines to 5 years suggests a 29% reduction over 5 years red points with the blue points figure of 33%,which is a very reasonable agreement.
Coulombic or Faraday Effciency (see Faraday efficiency - Wikipedia, the free encyclopedia)
The Coulombic efficiency can be defined as Ah during discharge divided by Ah during charge. For Li-ion batteries it seems to be 99% or higher. Some authors quote lower values but invariably it seems that they are quoting energy efficiency which is indeed somewhat less because of the small voltage drops during charge and discharge.
It is of course discharge capacity that is important, but until I can make some direct measurement of the discharge capacity for comparison with the charge capacity, I will assume >99% Coulombic efficiency and so claim my measurements show that my Kalkhoff 18Ah battery may drop to 12Ah capacity after 5 years. This is a very much longer life than I had anticipated before purchase after reading many warnings to budget for a replacement in one to two years, even with low usage such as mine of 2 cycles per month.
Attachments
-
 43.9 KB Views: 128
 -
 61.5 KB Views: 125